Pneumococcal diseases (PDs) are not listed as a notifiable infectious diseases in China, and there is a lack of dedicated surveillance systems specifically for PDs . Existing platforms such as disease information reporting system and cause-of-death registration system are unable to effectively capture high-quality epidemiological characteristics on PDs, including incidence, prevalence, and case fatality rates.
Currently, most available data on the epidemiological patterns and disease burden of PDs in China are derived from localized, community-based or hospital-based studies. There remains a lack of nationally representative, population-wide, high-quality data on pneumococcal disease burden. In 2022, Chinese scholars published a model study in The Lancet 1, estimating the pneumococcal disease burden for children in all provinces of China from 2010 to 2017. Ning Guijun2 and Yao Kaihu3 provided comprehensive overviews of pneumococcal disease burden in China in 2018 and 2020, respectively. Additionally, the 2020 Expert Consensus on Immunoprophylaxis for PD⁴ also addressed the burden of pneumococcal disease in China.
Carriage Rate of Streptococcus Pneumoniae
Cross-sectional surveys conducted in various countries have shown that the prevalence of nasopharyngeal Streptococcus pneumoniae carriage in infants and children ranges from 27% to 85%4. According to studies conducted from 1997-2004, the isolation rate of S. pneumoniae from nasopharyngeal swabs in Chinese children <5 years old who were healthy or had upper respiratory tract infections could range from 5.1% to 40.5%5. A 2018 survey using molecular biology testing methods found that S. pneumoniae colonization in healthy children aged 6-10 years old in Xinjiang Uygur Autonomous Region was as high as 88.6% 6. A meta-analysis showed that from 1997 to 2014, the nasopharyngeal carriage rate of S. pneumoniae in Chinese children was about 21.4%, with the highest rates observed in kindergarten children. The nasopharyngeal carriage rate of S. pneumoniae decreased with the increase of age. Additionally, before the introduction of PCV7 in China, the nasopharyngeal carriage rate of S. pneumoniae in children was 25.8%, which decreased to 14.1% after the introduction of PCV7.7
A 2022 cross-sectional survey conducted in Hainan Province reported that 30.4% of children carried S. pneumoniae. Compared to unvaccinated children, those who had received the PCV13 vaccine had a significantly lower carriage rate, at about 17.7%. Higher carriage rates were observed in children attending daycare, those living in rural areas, those with siblings, and those whose mothers had an education level of high school or vocational school. In contrast, children who had completed 3–4 doses of PCV13 showed significantly lower nasopharyngeal S. pneumoniae carriage rates.⁸
Morbidity
Streptococcus pneumoniae
A systematic review reported that from 1980 to 2008, the incidence of all-cause pneumonia among children under 5 years of age in China was 12,815 per 100,000 person-years (range: 8,625–18,623 per 100,000 person-years), and the mortality rate was 526 per 100,000 person-years (range: 262–1,053 per 100,000 person-years). It was estimated that in the year 2000, there were approximately 260,768 cases of pneumococcal pneumonia and 902 cases of pneumococcal meningitis, with 10,703 deaths from pneumococcal pneumonia and 75 deaths from pneumococcal meningitis, respectively (Table 1) ⁹.
Table 1 Mortality, morbidity and case-fatality rate due to pneumonia, meningitis and bacteremia, China, 1980-2008a
| Disease | Morbidity | Mortality | Case-fatality | |||
| Rate (nb ) | 95% CI | Rate (n) | 95% CI | Rate (n) | 95% CI | |
| Pneumonia by year (n = 12) | ||||||
| 1980-1989 | 6,935.6(3) | 4,775.66-9,444.9 | 520.2(3) | 479.9 – 1,565.6c | 2.0-1.0c | 1.4(2) |
| 1990-1999 | 14,210.9(8) | 8,663.1 – 22,438.6 | 551.4(8) | 237.8 – 1,273.7 | 1.4- 0.9c | 1.3(2) |
| Overall | 12,815(10) | 8,625 – 18,623 | 526(10) | 262 – 1,053 | 0.7 – 2.5 | 1.4(4) |
| Pneumonia by region (n = 10) | ||||||
| Eastern provinces | 18,807.0(3) | 12,909.1 – 22,701.8c | 577.9(3) | 71.2 – 700.8 | – | – |
| Central provinces | 8,370.6(4)d | 3,323.2-19,535.2 | 623.8(3) | 151.6 – 1,158.1 | – | 1.4(1) |
| Western provinces | 18,347.9(2) | 17,700.1c– 19,377.8 | 574.9(2) | 178.1- 1,469.9 | – | 0.9(1) |
| Meningitis (n = 4) | ||||||
| Total | 14(2) | 8.9- 19.2c | – | – | 2.5c– 9.1 | 8.3(3) |
a Mortality and morbidity were expressed as 1/100,000/year; case-fatality rate was expressed as percentages.
b n represents the number of articles.
c Numbers presented are from the original publication.
d Compared to Eastern and Western province, poisson regression, p<0.05
A global study on the burden of PD, about 1.74 million children under the age of 5 suffered from PD in China in 2000, accounting for 12% of global cases10. The World Health Organization (WHO) estimated that in 2015, China had more than 210,000 severe cases of PD among children under the age of 5, resulting in approximately 7,000 deaths. Nearly 200,000 of these were severe pneumococcal pneumonia cases, with a case fatality rate of 1% and a mortality rate of 6.43 per 100,00011. A model study published in The Lancet in 2022 indicated that in 2017, there were approximately 218,200 severe cases and around 8,000 deaths due to pneumococcal infection among children under 5 in China1.
A study conducted in Suzhou City, Jiangsu Province, China, between January 2010 and December 2017 12, collected 20,260 cerebrospinal fluid specimens from children under 5 years of age, and found that:
1) Among the 283 samples that tested positive for bacteria, 46 samples (46/283, 16.3%) tested positive for Streptococcus pneumoniae, making it the second most common bacterial infection.
2) Common diagnoses among children under 5 years old with invasive pneumococcal disease (IPD) included meningitis (31.4%), pneumonia (28.6%), and sepsis (21.0%) (Table 2).
3) The estimated annual hospitalization incidence rate for IPD in children under 5 years old in Suzhou was between 8.16 and 17.86 per 100,000, peaking in 2015. The IPD hospitalization incidence rate varied among different age groups, with the highest rate in children under 1 year old (21.78 per 100,000). The hospitalization incidence rates of pneumococcal meningitis, bacterial pneumonia, and sepsis among children under 5 were 4.57 per 100,000 (95% CI: 3.26–6.42), 4.16 per 100,000 (95% CI: 2.91–5.93), and 3.05 per 100,000 (95% CI: 2.01–4.62), respectively (Table 3).
Table 2 Characteristics of Invasive Pneumococcal Disease in Children in Suzhou, China, 2010 – 2017
| Characteristic | Age Group, no. (%) | |||
| <1 y | 1-<2 y | 2-<5 y | Total | |
| Total | 31 (100.0) | 17 (100.0) | 57 (100.0) | 105 (100.0) |
| Sex | ||||
| Male | 17 (54.8) | 10 (58.8) | 33 (57.9) | 60 (57.1) |
| Female | 14 (45.2) | 7 (41.2) | 24 (42.1) | 45 (42.9) |
| Year | ||||
| 2010 | 5 (16.1) | 1 (5.9) | 4 (7.0) | 10 (9.5) |
| 2011 | 4 (12.9) | 4 (23.5) | 3 (5.3) | 11 (10.5) |
| 2012 | 4 (12.9) | 1 (5.9) | 5 (8.8) | 10 (9.5) |
| 2013 | 5 (16.1) | 4 (23.5) | 4 (7.0) | 13 (12.4) |
| 2014 | 4 (12.9) | 4 (23.5) | 9 (15.8) | 17 (16.2) |
| 2015 | 5 (16.1) | 1 (5.9) | 12 (21.1) | 18 (17.1) |
| 2016 | 2 (6.5) | 1 (5.9) | 6 (10.5) | 9 (8.6) |
| 2017 | 2 (6.5) | 1 (5.9) | 14 (24.6) | 17 (16.2) |
| Primary discharge diagnosis | ||||
| Meningitis | 16 (51.6) | 4 (23.5) | 13 (22.8) | 33 (31.4) |
| Pneumonia | 7 (22.6) | 3 (17.6) | 20 (35.1) | 30 (28.6) |
| Sepsis | 6 (19.4) | 6 (35.3) | 10 (17.5) | 22 (21.0) |
| Upper respiratory infection | 1 (3.2) | 1 (5.9) | 1 (1.8) | 3 (2.9) |
| Bronchitis | 0 | 1 (5.9) | 1 (1.8) | 2 (1.9) |
| Other* | 1 (3.2) | 2 (11.8) | 12 (21.1) | 15 (14.3) |
*Other discharge diagnoses: leukemia (6), anemia (1), endocarditis (2), arrhythmia (2), acute otitis media (1), jaundice (1), acute gastritis (1), lumar muscle abscess (1).
Table 3 Estimated Hospitalization Incidence Rate of Invasive Pneumococcal Disease in Children Under 5 Years Old in Suzhou, China from 2010 to 2017
| Year | Children <1 y of age | Children 1–<2 y of age | Children 2–<5 y of age | ||||||
| IPD cases at SCH | Population | Hospitalization incidence* (95% CI) | IPD cases at SCH | Population | Hospitalization incidence* (95% CI) | IPD cases at SCH | Population | Hospitalization incidence* (95% CI) | |
| 2010 | 5 | 21,510 | 34.33 (14.67-80.35) | 1 | 19,433 | 7.60 (1.34-43.02) | 4 | 49,813 | 11.86 (4.61-30.51) |
| 2011 | 4 | 22,731 | 25.99 (10.11-66.81) | 4 | 20,136 | 29.34 (11.41-75.43) | 3 | 50,527 | 8.77 (2.98-25.79) |
| 2012 | 4 | 26,452 | 22.35 (8.69-57.46) | 1 | 25,483 | 5.80 (1.02-32.83) | 5 | 70,423 | 10.49 (4.48-25.54) |
| 2013 | 5 | 23,893 | 30.91 (13.20-72.35) | 4 | 31,228 | 18.92 (7.36-48.65) | 4 | 76,041 | 7.77 (3.02-19.98) |
| 2014 | 4 | 29,110 | 20.30 (7.89-52.18) | 4 | 28,006 | 21.10 (8.21-54.26) | 9 | 87,752 | 15.15 (7.97-28.79) |
| 2015 | 5 | 22,745 | 32.48 (13.87-76.02) | 1 | 34,119 | 4.33 (0.76-24.53) | 12 | 92,038 | 19.26 (11.02-33.66) |
| 2016 | 2 | 32,360 | 9.13 (2.5-33.28) | 1 | 27,768 | 5.32 (0.94-30.13) | 6 | 102,818 | 8.62 (3.95-18.80) |
| 2017 | 2 | 31,415 | 9.40 (2.58-34.28) | 1 | 38,255 | 3.86 (0.68-21.88) | 14 | 102,006 | 20.27 (12.07-34.02) |
| Total | 31 | 210,216 | 21.78 (15.34-30.91) | 17 | 224,428 | 11.19 (6.99-17.92) | 57 | 631,418 | 13.33 (10.29-17.27) |
* Incidence rate is cases/100,000 children.
SCH, Suzhou University Affiliated Children Hospital.
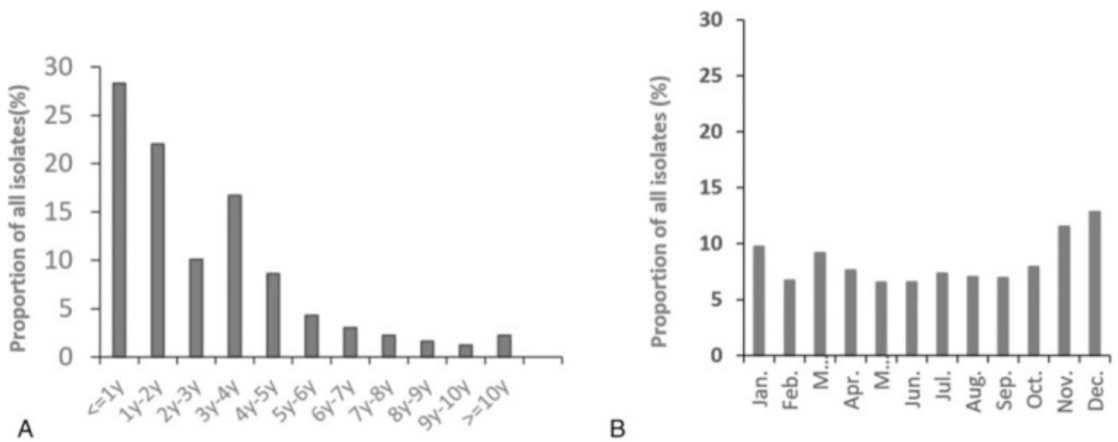
A study conducted in 2016 across 10 children’s hospitals in mainland China found that PD primarily affects children under 5 years old (85.1%), with those under 2 years old accounting for 50.3% (Figure 1A). The monthly incidence of PD is relatively stable but shows two peak periods: March (9.18%) and from November to January of the following year (11.25%, 12.85%, and 9.75%, respectively)13 (Figure 1B) .
One study estimated the number of pneumococcal pneumonia cases among children under 5 years old in China decreased from 633,400 cases in 2010 to 553,000 cases in 20171. Guangdong Province reported the highest number of pneumococcal pneumonia cases in this age group, with around 66,500 cases, while the Tibet Autonomous Region had the highest incidence rate, reaching 1,003 cases per 100,000 children under 5 years old (Table 4).
Table 4 Streptococcus pneumoniae cases in Chinese children aged 1–59 months in 2017
| Province | Streptococcus pneumoniae pneumonia cases | Streptococcus pneumoniae severe pneumonia cases | Streptococcus pneumoniae meningitis cases | Streptococcus pneumoniae severe NPNM cases | ||||
| Number | Rate | Number | Rate | Number | Rate | Number | Rate | |
| Anhui | 23379 (20172-27791) | 605 | 8572 (6422-9777) | 222 | 293 (181-393) | 8 | 333 (206-446) | 9 |
| Beijing | 7600 (6558-9035) | 812 | 2787 (2088-3178) | 298 | 39 (24-53) | 4 | 45 (28-60) | 5 |
| Chongqing | 11714 (10107-13925) | 714 | 4295 (3218-4899) | 262 | 98 (61-132) | 6 | 111 (69-150) | 7 |
| Fujian | 14825 (12791-17622) | 598 | 5435 (4072-6199) | 219 | 141 (87-189) | 6 | 160 (99-215) | 6 |
| Gansu | 10968 (9463-13038) | 745 | 4021 (3013-4587) | 273 | 310 (192-417) | 21 | 353 (218-473) | 24 |
| Guangdong | 66523 (67398-79077) | 885 | 24390 (18273-27819) | 324 | 542 (335-727) | 7 | 615 (381-826) | 8 |
| Guangxi | 24189 (20870-28753) | 601 | 8868 (6644-10115) | 220 | 238 (147-319) | 6 | 270 (167-362) | 7 |
| Guizhou | 15883 (13704-18880) | 562 | 5823 (4363-6642) | 206 | 137 (85-184) | 5 | 156 (96-209) | 6 |
| Hainan | 4410 (3805-5243) | 669 | 1617 (1211-1844) | 245 | 87 (54-117) | 13 | 99 (61-133) | 15 |
| Hebei | 34605 (29858-41135) | 669 | 12687 (9505-14471) | 245 | 831 (515-1116) | 16 | 944 (584-1267) | 18 |
| Heilongjiang | 9173 (7914-10904) | 835 | 3363 (2520-3836) | 306 | 144 (89-193) | 13 | 163 (101-219) | 15 |
| Henan | 36801 (31753-43746) | 496 | 13493 (10109-15390) | 182 | 604 (374-810) | 8 | 686 (424-920) | 9 |
| Hubei | 18328 (15813-21786) | 568 | 6720 (5034-7664) | 208 | 122 (76-164) | 4 | 139 (86-186) | 4 |
| Hunan | 23108 (19938-27469) | 521 | 8472 (6347-9663) | 191 | 119 (74-160) | 3 | 135 (84-181) | 3 |
| Inner Mongolia | 8772 (7569-10427) | 835 | 3216 (2409-3668) | 306 | 193 (119-258) | 18 | 219 (135-293) | 21 |
| Jiangsu | 23698 (20447-28170) | 619 | 8688 (6509-9910) | 227 | 107 (66-144) | 3 | 122 (75-163) | 3 |
| Jiangxi | 19089 (16471-22692) | 611 | 6999 (5243-7983) | 224 | 458 (284-615) | 15 | 521 (322-699) | 17 |
| Jilin | 8762 (7560-10416) | 918 | 3213 (2407-3664) | 336 | 166 (103-223) | 17 | 189 (117-254) | 20 |
| Liaoning | 12264 (10582-14579) | 872 | 4497 (3369-5129) | 320 | 60 (37-81) | 4 | 69 (42-92) | 5 |
| Ningxia | 3103 (2678-3689) | 688 | 1138 (852-1298) | 252 | 66 (41-89) | 15 | 75 (47-101) | 17 |
| Qinghai | 2968 (2561-3528) | 788 | 1088 (815-1241) | 289 | 118 (73-159) | 31 | 134 (83-180) | 36 |
| Shaanxi | 13118 (11319-15594) | 656 | 4810 (3603-5486) | 240 | 353 (218-473) | 18 | 401 (248-538) | 20 |
| Shandong | 31314 (27019-37224) | 515 | 11481 (8601-13095) | 189 | 242 (150-324) | 4 | 274 (170-368) | 5 |
| Shanghai | 7853 (6776-9335) | 822 | 2879 (2157-3284) | 301 | 44 (27-60) | 5 | 50 (31-68) | 5 |
| Shanxi | 12895 (11126-15329) | 698 | 4728 (3542-5392) | 256 | 304 (188-408) | 16 | 345 (214-463) | 19 |
| Sichuan | 35875 (30954-42645) | 863 | 13153 (9854-15002) | 316 | 403 (250-541) | 10 | 458 (284-615) | 11 |
| Tianjin | 4743 (4092-5638) | 823 | 1739 (1303-1983) | 302 | 43 (27-58) | 7 | 49 (30-65) | 8 |
| Tibet | 2738 (2362-3255) | 1003 | 1004 (752-1145) | 368 | 33 (18-53) | 12 | 37 (20-60) | 14 |
| Xinjiang | 14296 (12335-16994) | 703 | 5241 (3927-5978) | 258 | 291 (222-481) | 14 | 330 (252-546) | 16 |
| Yunnan | 27765 (23956-33005) | 976 | 10180 (7626-11611) | 358 | 491 (304-659) | 17 | 558 (345-749) | 20 |
| Zhejiang | 22278 (19222-26482) | 829 | 8168 (6119-9316) | 304 | 146 (90-195) | 5 | 165 (102-222) | 6 |
| Central | 190550 (164411-226510) | 599 | 69862 (52340-79684) | 220 | 3129 (1936-4198) | 10 | 3554 (2199-4768) | 11 |
| East | 191099 (164884-227163) | 722 | 70063 (52491-79914) | 265 | 1364 (844-1831) | 5 | 1550 (959-2079) | 6 |
| West | 171388 (147877-203732) | 740 | 62837 (47077-71671) | 271 | 2731 (1729-3764) | 12 | 3102 (1964-4275) | 13 |
| Nationwide | 553037 (477172-657405) | 679 | 202762 (151908-231270) | 249 | 7225 (4510-9793) | 9 | 8206 (5123-11123) | 10 |
All Streptococcus pneumoniae meningitis cases are severe.
Rate per 100 000
Streptococcus Pneumoniae Meningitis
An epidemiological study conducted in Nanning, Guangxi, between 2000 and 2002 reported an annual incidence of S. pneumoniae meningitis of 1.3 per 100,000 among children under 5 years of age, based on bacterial culture results14. Another epidemiological study conducted between 2006 and 2009 in four regions of China (Jinan, Shandong; Yichang, Hubei; Guigang, Guangxi; and Shijiazhuang, Hebei) reported an annual incidence of bacterial meningitis ranging from 1.84 to 2.93 per 100,000 in the general population, and 6.95 to 22.30 per 100,000 among children under 5 years of age15. S. pneumoniae was identified as the most common pathogen, accounting for 39 confirmed cases15. Li et al. indicated that among children and adults with IPD, the proportion of cases involving meningitis was 21.3% (29/136) and 17.3% (23/133), respectively (Table 5)16.
Table 5 Serotype Distribution of 269 Cases of Invasive Pneumococcal Disease in China
| Population | Children (by serotype) n=136 | Adults (by serotype) n=133 | |||||||||||||||
| IPD | Children (136) | Adults (133) | Total N=269 | 19A | 23F | 19F | 3 | 14 | 6B | Other | 19A | 23 F | 19 F | 3 | 14 | 6B | Other |
| Pneumoniae | 37 (27.2) | 48 (36.1) | 85 (31.6) | 14 (37.8) | 8 (21.6) | 5 (13.5) | 0 (0.0) | 4 (10.8) | 2 (5.4) | 4 (10.8) | 5 (10.4) | 1 (2.1) | 5 (10.4) | 12 (25.0) | 2 (4.2) | 2 (4.2) | 21 (43.8) |
| Septis | 48 (35.3) | 22 (16.5) | 70 (26.0) | 8 (16.7) | 6 (12.5) | 11 (22.9) | 3 (6.3) | 3 (6.3) | 3 (6.3) | 14 (29.2) | 0 (0.0) | 3 (13.6) | 3 (13.6) | 4 (18.2) | 3 (13.6) | 1 (4.5) | 8 (36.4) |
| Meningitis | 29 (21.3) | 23 (17.3) | 52 (19.3) | 4 (13.8) | 9 (31.0) | 5 (17.2) | 1 (3.4) | 2 (6.9) | 1 (3.4) | 7 (24.1) | 3 (13.0) | 1 (4.3) | 4 (17.4) | 3 (13.0) | 0 (0.0) | 0 (0.0) | 12 (52.2) |
| Bacteremia | 5 (3.7) | 20 (15.0) | 25 (9.3) | 1 (20.0) | 1 (20.0) | 1 (20.0) | 0 (0.0) | 1 (20.0) | 1 (20.0) | 0 (0.0) | 2 (10.0) | 2 (10.0) | 2 (10.0) | 6 (30.0) | 1 (5.0) | 0 (0.0) | 7 (35.0) |
| Other | 17 (12.5) | 20 (15.0) | 37 (13.8) | 2 (11.8) | 5 (29.4) | 4 (23.5) | 0 (0.0) | 2 (11.8) | 0 (0.0) | 4 (23.5) | 3 (15.0) | 3 (15.0) | 1 (5.0) | 3 (15.0) | 3 (15.0) | 1 (5.0) | 6 (30.0) |
Data from population-based surveillance of bacterial meningitis in China from September 2006 to December 2009 showed that 52.7% of bacterial meningitis in children under 5 years of age was caused by S. pneumoniae ; among children under 2 years of age, the predominant pathogens were S. pneumoniae and Haemophilus influenzae type B 15. Another study analyzed the clinical characteristics and etiology of bacterial meningitis in children over 28 days of age in China from January 2014 to December 2016 and found that 46.9% was caused by S. pneumoniae, and that S. pneumoniae was the most common etiologic agent in children over 3 months of age (54.7%) (Figure 2, Table 6)17 .
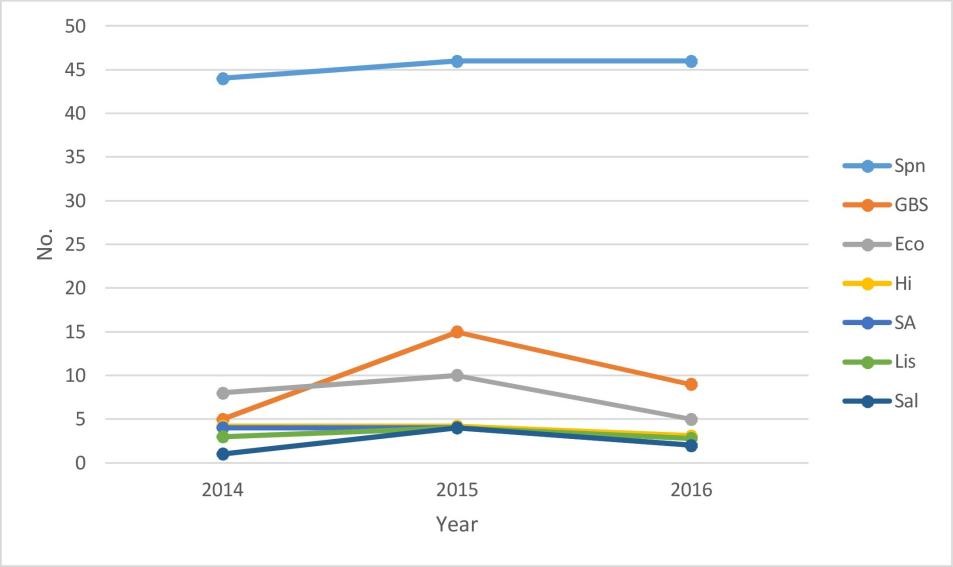
Note: Spn, Streptococcus pneumoniae; GBS, group B streptococcus; Eco, Escherichia coli; Hi, Haemophilus influenzae; SA, Staphylococcus aureus; Lis, Listeria monocytogenes; Sal, Salmonella
Table 6 Age Distribution of Bacterial Meningitis Cases Caused by Different Pathogens
| Pathogen | 28 days – 2 months n (%) | 3-11 months n (%) | 12-35 months n (%) | 3-6 years n (%) | >6 years n (%) | Total n (%) |
| Spn | 1 (2.3) | 58 (50.4) | 37 (56.1) | 22 (59.5) | 18 (62.1) | 136 (46.9) |
| GBS | 20 (46.5) | 8 (7.0) | 1 (1.5) | 0 (0.0) | 0 (0.0) | 29 (10.0) |
| Eco | 10 (23.3) | 13 (11.3) | 0 (0.0) | 0 (0.0) | 0 (0.0) | 23 (7.9) |
| Hi | 0 (0.0) | 8 (7.0) | 0 (0.0) | 2 (5.4) | 1 (3.4) | 11 (3.8) |
| SA | 3 (7.0) | 3 (2.6) | 2 (3.0) | 2 (5.4) | 0 (0.0) | 10 (3.5) |
| Lis | 0 (0.0) | 3 (2.6) | 5 (7.6) | 1 (2.7) | 1 (3.4) | 10 (3.5) |
| Sal | 0 (0.0) | 6 (5.2) | 0 (0.0) | 0 (0.0) | 1 (3.4) | 7 (2.4) |
| Nm | 0 (0.0) | 0 (0.0) | 1 (1.5) | 0 (0.0) | 0 (0.0) | 1 (0.3) |
| Others | 9 (20.9) | 16 (13.9) | 20 (30.3) | 10 (27.0) | 8 (27.7) | 63 (21.7) |
| Total | 43 (14.8) | 115 (39.7) | 66 (22.8) | 37 (12.7) | 29 (10.0) | 290 (100.0) |
Spn, Streptococcus pneumoniae; GBS, group B streptococcus; Eco, Escherichia coli; Hi, Haemophilus influenzae; SA, Staphylococcus aureus; Lis, Listeria monocytogenes; Sal, Salmonella; Nm, Neisseria meningitidis.
It is estimated that in 2010, the incidence rate of S. pneumoniae meningitis among children aged under 1 year of age was 9.21 per 100,000, with a case-fatality rate of 6.23% (94/1509); the incidence rate of S. pneumoniae meningitis among children aged 1 to 4 years was 5.56 per 100,000, with a case-fatality rate of 4.26% (156/3660) 11. The age-standardized incidence rate of pneumococcal meningitis decreased from 3.45 per 100,000 in 1990 to 1.42 per 100,000 in 2010, a reduction of 58.84%. The age-standardized mortality rate decreased from 0.49 per 100,000 to 0.11 per 100,000, a reduction of 77.55%. The age-standardized disability-adjusted life years (DALY) for pneumococcal meningitis decreased from 33.97 years per 100,000 in 1990 to 9.5 years per 100,000 in 2010 (Tables 10 and 11) 11 . Additionally, the Global Burden of Disease Study estimated that in 2016, there were 606.4 deaths due to pneumococcal meningitis in China, with a mortality rate of 0.04 per 100,000 and a loss of 52,300 life years18.
Table 7 Pneumococcal Meningitis Morbidity, Mortality, and Burden of Disease, 1990 and 2010
| Gender | Year | Incidence | Standardized Incidence (per 100,000) | Deaths | Standardized Mortality (per 100,000) | DALYs (person-years) | DALY Rate (per 100,000) | YLD (person-years) | YLD Rate (per 100,000) | YLL (person-years) | YLL Rate (per 100,000) |
| Male | |||||||||||
| 1990 | 24,831 | 3.46 | 3,291 | 0.54 | 252,871.75 | 37.36 | 52,499.09 | 10.59 | 200,372.66 | 26.77 | |
| 2010 | 11,196 | 1.52 | 857 | 0.13 | 75,923.36 | 10.9 | 34,381.91 | 5.14 | 41,541.45 | 5.76 | |
| Change | -13,635 | -1.94 | -2,434 | -0.41 | -176,948.40 | -26.46 | -18,117.18 | -5.45 | -158,831.20 | -21.01 | |
| Change (%) | -54.91% | -56.07% | -73.96% | -75.93% | -69.98% | -70.82% | -34.51% | -51.46% | -79.27% | -78.48% | |
| Female | |||||||||||
| 1990 | 23,048 | 3.44 | 2,521 | 0.44 | 190,222.11 | 30.37 | 43,444.38 | 9.1 | 146,777.74 | 21.27 | |
| 2010 | 8,686 | 1.32 | 577 | 0.09 | 51,990.15 | 8.01 | 25,382.92 | 3.96 | 26,607.23 | 4.05 | |
| Change | -14,362 | -2.12 | -1,944 | -0.35 | -138,232.00 | -22.36 | -18,061.46 | -5.14 | -120,170.50 | -17.22 | |
| Change (%) | -62.32% | -61.63% | -77.11% | -79.55% | -72.67% | -73.63% | -41.57% | -56.48% | -81.87% | -80.96% | |
| Total | |||||||||||
| 1990 | 47,879 | 3.45 | 5,812 | 0.49 | 443,093.86 | 33.97 | 95,943.47 | 9.85 | 347,150.40 | 24.12 | |
| 2010 | 19,882 | 1.42 | 1,434 | 0.11 | 127,913.51 | 9.5 | 59,764.83 | 4.57 | 68,148.68 | 4.94 | |
| Change | -27,997 | -2.03 | -4,378 | -0.38 | -315,180.40 | -24.47 | -36,178.64 | -5.28 | -279,001.70 | -19.18 | |
| Change (%) | -58.47% | -58.84% | -75.33% | -77.55% | -71.13% | -72.03% | -37.71% | -53.60% | -80.37% | -79.52% |
Table 8 Pneumococcal Meningitis Morbidity, Mortality and Burden of Disease by Age Group, 1990 and 2010
| Year | Age Group (years) | Incidence | Incidence Rate (per 100,000) | Deaths | Mortality Rate (per 100,000) | DALYs (person-years) | DALY Rate (per 100,000) | YLD (person-years) | YLD Rate (per 100,000) | YLL (person-years) | YLL Rate (per 100,000) |
| 1990 | <1 | 4,212 | 17.61 | 615 | 2.57 | 52,924.59 | 221.2 | 102.37 | 0.43 | 52,822.22 | 220.77 |
| 1–4 | 11,046 | 11.61 | 1,054 | 1.11 | 90,224.04 | 94.81 | 1,768.81 | 1.86 | 88,455.23 | 92.96 | |
| 5–14 | 11,065 | 5.58 | 606 | 0.31 | 56,809.86 | 28.67 | 10,397.59 | 5.25 | 46,412.27 | 23.42 | |
| 15–49 | 16,804 | 2.65 | 2342 | 0.37 | 186,729.12 | 29.4 | 6,869.92 | 8.38 | 133,523.55 | 21.02 | |
| 50–69 | 3,506 | 2.41 | 721 | 0.49 | 40,795.78 | 27.75 | 5,786.00 | 14.01 | 20,197.82 | 13.74 | |
| ≥70 | 1,206 | 2.86 | 474 | 1.12 | 15,610.48 | 37.06 | 9,871.17 | 23.43 | 5,739.30 | 13.62 | |
| 2010 | <1 | 1,509 | 9.21 | 94 | 0.57 | 8,107.42 | 49.49 | 1.62 | 0.21 | 8,072.66 | 49.28 |
| 1–4 | 3,660 | 5.56 | 156 | 0.24 | 13,641.07 | 20.73 | 1,163.45 | 0.82 | 13,104.58 | 19.91 | |
| 5–14 | 3916 | 2.18 | 94 | 0.05 | 11,703.70 | 6.53 | 569.81 | 2.54 | 7144.44 | 3.98 | |
| 15–49 | 7,511 | 1 | 504 | 0.07 | 57,873.39 | 7.68 | 4,943.89 | 4.06 | 27,262.52 | 3.62 | |
| 50–69 | 2,445 | 0.96 | 344 | 0.13 | 26,173.42 | 10.24 | 5,547.38 | 6.46 | 9,662.26 | 3.78 | |
| ≥70 | 841 | 1.09 | 244 | 0.34 | 10,414.51 | 14.7 | 12,549.73 | 10.6 | 2,902.23 | 4.1 |
Streptococcus Pneumoniae Bacteremia
The results of a multicenter clinical study conducted by Li et al. showed that the among IPD cases in China, the proportions of bacteremia and sepsis were 9.3% and 26.0%, respectively 16. Specifically, the proportions of S. pneumoniae bacteremia were 3.7% in children and 15.0% in adults, while the proportions of S. pneumoniae sepsis were 35.3% in children and 16.5% in adults.Results from a study in Suzhou showed that the hospitalization rate for S. pneumoniae bacteremia was 4.16/100,000 (95% CI: 2.91-5.93/100,000) in children <5 years of age, and 3.05/100,000 (95% CI: 2.01-4.62/100,000) for S. pneumoniae 12. In Taiwan, the incidence rates of pneumococcal bacteremia are 0.9 per 100,000 person-years for the 50–64 age group, 2.5 per 100,000 person-years for the 65–74 age group, 6.1 per 100,000 person-years for the 75–84 age group, and 12.3 per 100,000 person-years for those aged 85 and older (Table 9) 19.
Table 9 Incidence, Fatality, and Cost of Pneumococcal Disease in Adults Aged 50 and Over in Taiwan, China from 2002 to 2009
| Age groups, years | ||||
| 50-64 | 65-74 | 75-84 | ≥85 | |
| Incidence Rate (per 100,000 person-years) | ||||
| Pneumococcal meningitis | 0.1 | 0.1 | 0.1 | 0.1 |
| Pneumococcal bacteremia | 0.9 | 2.5 | 6.1 | 12.3 |
| Hospitalized pneumococcal pneumonia | 84.4 | 313.1 | 820.3 | 1650.9 |
| Outpatient pneumococcal pneumonia | 716.0 | 1645.5 | 3198.2 | 5305.8 |
| Case fatality Rate (%) | ||||
| Pneumococcal meningitis | 5.3 | – | 12.5 | – |
| Pneumococcal bacteremia | 7.8 | 8.2 | 16.1 | 18.7 |
| Hospitalized pneumococcal pneumonia | 7.6 | 7.8 | 10.9 | 13.6 |
| Direct cost per case (NTD) | ||||
| Pneumococcal meningitis | 273,293 | 193,528 | 344,621 | 203,359 |
| Pneumococcal bacteremia | 120,597 | 133,753 | 139,662 | 126,994 |
| Hospitalized pneumococcal pneumonia | 152,568 | 169,419 | 176,382 | 177,723 |
| Outpatient pneumococcal pneumonia | 1614 | 1983 | 2281 | 2481 |
| Indirect cost per case (NTD) | ||||
| Pneumococcal meningitis | 15,960 | 5901 | 4496 | 8771 |
| Pneumococcal bacteremia | 11,704 | 3372 | 3653 | 3372 |
| Hospitalized pneumococcal pneumonia | 11,704 | 3372 | 3653 | 3934 |
| Outpatient pneumococcal pneumonia | 532 | 141 | 141 | 141 |
Economic Burden
average medical cost per hospitalization for pneumonia was 5,026.76 CNY. Medical costs for all-cause pneumonia and meningitis from hospital records or medical insurance show significant regional differences, with meningitis treatment costs being substantially higher than those for pneumonia, and costs being relatively higher for children under 2 years old and adults over 50 years old3,20. There is limited data on the medical costs for laboratory-confirmed PDs in China. From 2005 to 2009, Shanghai Children’s Hospital diagnosed 27 cases of IPD in patients under 18 years old, with an average hospital stay of 20.48 days and an average treatment cost of 18,517.39 CNY. For pneumococcal sepsis, meningitis, and pneumonia, the average medical costs were 22,143.88 CNY, 28,899.48 CNY, and 4,295.65 CNY, respectively21. A total of 69 patients with S. pneumoniae meningitis were diagnosed at sentinel hospitals in Jinan, Shandong Province, Yichang, Hubei Province, and Shijiazhuang, Hebei Province, from September 2006 to December 2014, with a per capita direct medical cost of 43,200 CNY, direct non-medical cost of 10,000 CNY, and total direct cost of 5.32 million CNY; total indirect costs were 10.06 million CNY; and total costs were 63.8 million CNY 15.
Serotype Distribution
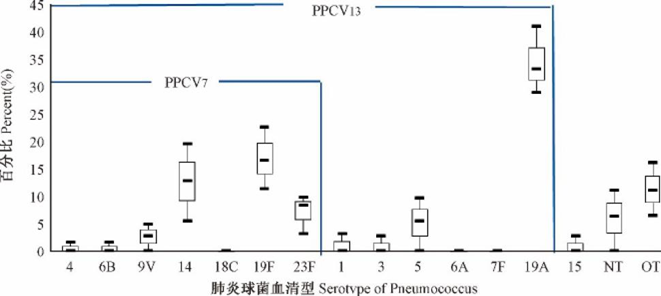
A systematic study in 2014 showed that the serotype distribution of invasive pneumococcal serotypes in Chinese children under 5 years of age was 19A (33.3%, IQR: 31.2%-33.3%), 19F (16.7% , IQR: 14.1%-19.6%), and 14 (12.9%, IQR: 9.2%-16.3%) (Figure 3) 22. A meta-analysis in 2019 showed that the prevalent serotypes in Chinese children were characterized by 19F (27.7%, 95% CI: 17.7-37.6%), 19A (21.2%, 95% CI: 16.4-26.1%), 14 (16.5%, 95% CI: 12.8-20.1%), 6B (8.6%, 95% CI: 5.2- 10.8%) and 23F (7.3%, 95% CI: 5.2-9.5%) were predominant. The estimated serotype coverage of PCV7, PCV10, and PCV13 was 60.8% (52.5-69.4%), 65.1% (57.7-72.4%) and 90.0% (87.1-92.8%), respectively 23.
A systematic review published in 2020 reported that the most common pneumococcal serotypes among children in mainland China were 19A (215, 22.8%), 19F (195, 20.7%), 14 (185, 19.6%), 23F (89, 9.4%), and 6B (79, 8.4%), and the serotype coverage of PCV13 was 90.4% (Table 10) 24. The study emphasized that most of the included literature highlighted the high serotype coverage of PCV13, the importance of vaccinating children with this vaccine, and recommended that pneumococcal conjugate vaccines be included in the National Immunization Program.
Table 10 Systematic Review of Serotype Distribution of Invasive Pneumococcal Disease in Children in Mainland China
| No. | Study Period | Location in China | Age (years or months) | No. of strains | Specimen sources | Serotypes (%) | Vaccine Serotype Coverage (%) | |
| PCV13 | PPV23 | |||||||
| 1 | 2006-200825 | Multi-lefta | ≤ 14 years | 171 | Blood, CSFd, PLe, arthroedema | 14 (20.5%), 19A (19.3%), 19F (17.0%), 6B (9.4%), 23F (7.6%), 18C (4.1%), 1 (3.5%), 6A (2.9%), 5 (2.3%), 9V (1.8%), 3 (1.2%), 8 (1.2%), 18(1.2%), 34 (1.2%), 11A (0.6%), 11B (0.6%), 12A (0.6%), 15B (0.6%), 17A (0.6%), 18F (0.6%), 24F (0.6%), 7C (0.6%), 7F (0.6%), 9N (0.6%), 16 (0.6%), 29 (0.6%) | 90.1% | 90.1% |
| 2 | 2000.01-2014.0826 | Shenyang, Liaoning | ≤ 14 years | 256 | Blood, CSF, PL, ascites, arthroedema | 19A (35.9%), 14 (17.2%), 19F (16.0%), 6B (9.0%), 23F (8.2%), others (13.7%) | 93.8% | – |
| 3 | 2007.01-2010.1227 | Nanjing, Jiangsu | NRc | 48 | Blood, CSF, PL, fester, ascites | 19F (27.1%), 19A (22.8%), 14 (18.7%), 9V (8.3%), 6B (6.3%), 23F (6.3%), 7F (4.2%), 8 (2.1%),NTc (4.2%) | 93.7% | 95.8% |
| 4 | 2010.02-2013.0828 | Shenzhen, Guangdong | ≤ 14 years | 76 | Blood, CSF, PL, fester | 19F (31.58%), 19A (22.37%), 14 (15.79%), 9V (7.89%), 6B (6.59%), 23F (6.59%), 7F (3.95%), 8 (2.63%), untyped (2.63%) | 94.7% | 97.4% |
| 5 | 2009.01-2013.1229 | Nanjing, Jiangsu | NR | 51 | Blood, CSF, PL, arthroedema, hydropericardium | 19F (27.45%), 19A (19.61%), 14 (17.65%), 9V (9.81%), 6B (7.84%), 23F (7.84%), 7F (5.88%), 8 (1.96%), untyped (1.96%) | 96.1% | 98.0% |
| 6 | 2011.10-2014.0530 | Wenling, Zhejiang | 0-107 months | 67 | Blood, CSF, PL, Ascites | 23F (22.4%), 14 (20.9%), 6B (17.9%), 19F (9.0%), 19A (9.0%), 5 (7.5%), 9V (4.5%), 19B (3.0%), UTd (6.0%) | 91.0% | 91.0% |
| 7 | 2012.04-2017.0331 | Beijing | ≤ 14 years | 111 | Blood, CSF, PL, fester, subdural effusion, bone marrow | 19F (22.5%), 19A (17.1%), 14 (16.2%), 23F (13.5%), 6B (9.0%), 6A (4.5%), 9V (3.6%), 5 (1.8%), 15B (1.8%), 24B (1.8%), 6C (1.8%), 3 (0.9%), 4 (0.9%), 8 (0.9%) , 11A (0.9%), 15C (0.9%), 19B (0.9%), 24F (0.9%) | 90.1% | 89.2% |
| 8 | 2009.01-2012.0832 | Shenzhen, Guangdong | ≤ 14 years | 87 | Blood, CSF, PL, fester, ascites, arthroedema, broncho-alveolar lavage | 19F (28.7%), 14 (25.3%), 23F (11.5%), 19A (9.2%), 6B (6.9%), Other (18.4%) | 89.7% | – |
| 9 | 2005.01-2006.1233 | Multi-leftb | < 5 years | 31 | Blood, CSF, PL | 19A (29.0%), 19F (22.5%), 14 (12.9%), 5 (9.7%), 11A (6.5%), 23F (3.2%), Other (16.2%) | 77.4% | 83.9% |
| 10 | 2013.01-2016.0434 | Beijing | ≤ 14 years old | 30 | Blood, CSF, PL, fester, ascites, bone marrow | 19f (36.7%), 19a (33.3%), 14 (13.3%), 23f (6.7%), 6a (6.7%), 11a (3.3%) | 96.7% | 93.3% |
a This multi-left study involved 11 cities in 10 provinces: Beijing; Tianjin; Shenyang, Liaoning; Shanghai; Nanjing, Jiangsu; Suzhou, Jiangsu; Wenzhou, Zhejiang; Hefei, Anhui; Shenzhen, Guangdong; Xinjiang; Chongqing
bThis multi-left study involved 8 cities in 8 provinces: Beijing; Shanghai; Shenzhen, Guangdong; Chengdu, Sichuan; Nanjing, Jiangsu; Wuhan, Hubei; Shenyang, Liaoning; Hangzhou, Zhejiang
cNR, pediatric patients, but the accurate age information was not reported
dCSF, cerebrospinal fluid
ePL, pleural fluid
Drug Resistance
S. pneumoniae is commonly categorized as penicillin-sensitive(PSSP), penicillin-intermediate(PISP) and penicillin-resistant(PRSP). According to the 2023 bacterial resistance monitoring results from the China Antimicrobial Surveillance Network (CHINET), non-meningitis S. pneumoniae in both children and adults shows the highest resistance to erythromycin, followed by clindamycin 35.
The resistance rates of S. pneumoniae isolated from children under 5 years old with community-acquired pneumonia in western China to erythromycin, tetracycline, clindamycin and trimethoprim-sulfamethoxazole were 94.3%, 87.8%, 94.7% and 81.1%, respectively. Additionally, 93.8% (393/419) of the isolates showed multidrug resistance36.
A 2019 multicenter study conducted in 2019 involving 10 children’s hospitals in mainland China found that PD mainly occurred in children under 5 years of age (85.1%), and S. pneumoniae had a high rate of resistance to commonly used antibiotics. For example, the resistance rates to clindamycin, erythromycin, tetracycline, and methotrexate/sulfamethoxazole were 95.8%, 95.2%, 93.6%, and 66.7%, respectively Penicillin resistance was observed in 79.5% of invasive strains and 1.3% of non-invasive strains. Multidrug resistance was also prevalent, with 21.4% (1,315/6,132) of isolates exhibiting multidrug resistance. Among IPD patients, the multidrug resistance rate was 46.1%, which was significantly higher than that observed in non-invasive cases (18.3%) 37.
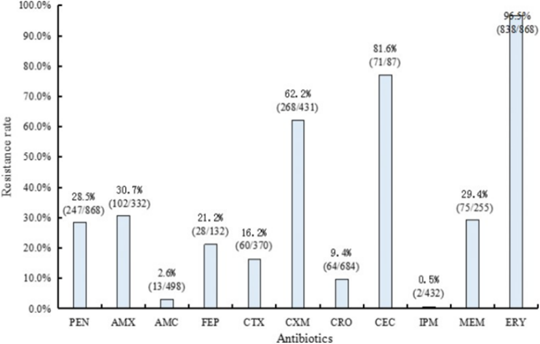
Another systematic review published in 2019 analyzing the drug resistance pattern of IPD in children in mainland China reported that resistance rates of 32.0% (95% CI: 12.1–51.9%) to penicillin, 94.4% (95% CI: 90.7–98.1%) to erythromycin, 92.3% (95% CI: 87.4–97.3%) to clindamycin, 83.7% (95% CI: 75.1–92.2%) to tetracycline, and 74.4% (95% CI: 64.5–84.4%) to sulfamethoxazole 23. A systematic review published in 2020 that assessed serotype distribution and/or antimicrobial resistance in pediatric IPD cases in mainland China3 also emphasized the high resistance of S. pneumoniae to cefuroxime and erythromycin (Figure 4) 3.
Content Editor: Xiaotong Yang, Ziqi Liu, Tianyi Deng
Page Editor: Ziqi Liu
References
1 Lai X, Wahl B, Yu W, et al. National, regional, and provincial disease burden attributed to Streptococcus pneumoniae and Haemophilus influenzae type b in children in China: Modelled estimates for 2010-17. Lancet Reg Health West Pac. 2022, 16;22:100430. doi: 10.1016/j.lanwpc.2022.100430.
2 NING Guijun, YIN Zundong. Progress of research on the disease burden of pneumococcal disease in China. China Public Health, 2018, 34(11):1453-1455.
3 Yao, Kai-Hu. Overview of the burden of pneumococcal disease in China. Chinese Medical Journal, 2020, 100(42):3363-3366
4 Vaccine and Immunization Branch, Chinese Preventive Medicine Association. Expert consensus on immunization for prevention of pneumococcal disease in China (2017). Chinese Journal of Epidemiology. 2018;39(2):111–138. DOI:10.3760/cma.j.issn.0254-6450.2018.02.001
5 Yao KH, Yang YH. Streptococcus pneumoniae diseases in Chinese children: past, present and future[J]. Vaccine, 2008,26(35):4425-4433. DOI: 10.1016/j.vaccine.2008.06.052
6 XieN, ChenZY, ChenT, et al. A Cross-sectional Survey Assessing Carriage of Streptococcus pneumoniae in a Healthy Population in Xinjiang Uygur Autonomous Region of China[J]. Biomed Environ Sci, 2018,31(3):233-237. DOI: 10.3967/bes2018.029
7 Wang L, Fu J, Liang Z, et al. Prevalence and serotype distribution of nasopharyngeal carriage of Streptococcus pneumoniae in China: a meta-analysis. BMC Infect Dis. 2017;17(1):765. Published 2017 Dec 13. DOI: 10.1186/s12879-017-2816-8
8 Wang, J., Qiu, L., Bai, S. et al. Prevalence and serotype distribution of nasopharyngeal carriage of Streptococcus pneumonia among healthy children under 5 years of age in Hainan Province, China. Infect Dis Poverty 13, 7 (2024). https://doi.org/10.1186/s40249-024-01175-7
9 Chen Y, Deng W, Wang SM, et al. Burden of pneumonia and meningitis caused by Streptococcus pneumoniae in China among children under 5 years of age: a systematic literature review. PLoS One. 2011;6(11):e27333.
10 O’Brien KL, Wolfson LJ, Watt JP, et al. Burden of disease caused by Streptococcus pneumoniae in children younger than 5 years: global estimates. Lancet. 2009 Sep 12;374(9693):893-902.
11SUN Jin-fang, YAO Hong-yan, YU Shi-cheng, HU Yue-hua, WANG Qi-qi, PI Wan-di, ZHOU Mai-geng, LIU Shi-wei, LI Yi-chong. Disease Burden of three kinds of bacterial meningitis in China,1990 and 2010[J]. Disease Surveillance, 2015, 30(12): 1008-1013. DOI: 10.3784/j.issn.1003-9961.2015.12.006
12 Chen K, Zhang X, Tao Y, et al. Hospitalization for Invasive Pneumococcal Diseases in Young Children before Use of 13-Valent Pneumococcal Conjugate Vaccine, Suzhou, China. Emerg Infect Dis. 2021 Jan;27(1):69-75.
13 Wang CY, Chen YH, Fang C, et al. Antibiotic resistance profiles and multidrug resistance patterns of Streptococcus pneumoniae in pediatrics: a multicenter retrospective study in mainland China. medicine (Baltimore). 2019;98(24):e15942
14 Dong BQ, Tang ZZ, Lin M, et al. Epidemiologic surveillance for bacterial meningitis in 140,000 children under 5 years of age in Nanning District, Guangxi Province. Chinese Journal of Epidemiology. 2004;25(5):391–395.
15 LiY, YinZ, ShaoZ, et al. Population-based surveillance for bacterial meningitis in China, September 2006-December 2009. Emerg Infect Dis, 2014,20(1) :61-9.
16 Li MC, Wang Y, Zhang H, et al. Serotype distribution and clinical characteristics associated with streptococcus pneumoniae among Chinese children and adults with invasive pneumococcal disease: a multicenter observational study. Hum Vaccin Immunother. 2021 Jan 2;17(1):146-156.
17 Li C, Feng WY, Lin AW, et al. Clinical characteristics and etiology of bacterial meningitis in Chinese children >28 days of age, January 2014-December 2016: A multicenter retrospective study. Int J Infect Dis. 2018 Sep;74:47-53.DOI: 10.1016/j.ijid.2018.06.023
18 GBD 2016 Causes of Death Collaborators. Global, regional, and national age-sex specific mortality for 264 causes of death, 1980-2016: a systematic analysis for the Global Burden of Disease Study 2016[J]. Lancet, 2017, 390(10100): 1151-1210. DOI: 10.1016/S0140-6736(17)32152-9.
19 Wu DB, Roberts CS, Huang YC, et al. A retrospective study to assess the epidemiological and economic burden of pneumococcal diseases in adults aged 50 years and older in Taiwan. J Med Econ. 2014 May;17(5):312-9.
20 National Health Commission of the People’s Republic of China. 2018 China Health and Family Planning Statistical Yearbook [monograph]. Beijing: Peking Union Medical College Press; 2018.
21 Song Shengfan. Health Economics Evaluation of Streptococcus pneumoniae Disease Cost Study and Heptavalent Pneumococcal Conjugate Vaccine [D]. Shanghai: Fudan University, 2013.
22 WEI Ning,AN Zhijie,WANG Huaqing. Systematic evaluation of pneumococcal serotype distribution among pneumococcal-associated cases in Chinese population ≤18 years old[J]. China Vaccine and Immunization,2014,06:547-555.
23 Fu J, Yi R, Jiang Y, et al. Serotype distribution and antimicrobial resistance of Streptococcus pneumoniae causing invasive diseases in China: a meta- analysis. BMC Pediatr. 2019;19(1):424. published 2019 Nov 11.
24 Men W, Dong Q, Shi W, et al. Serotype distribution and antimicrobial resistance patterns of invasive pneumococcal disease isolates from children in mainland China-a systematic review. Braz J Microbiol. 2020;51(2):665-672.
25 Xue L, Yao K, Xie G, et al. Serotype distribution and antimicrobial resistance of Streptococcus pneumoniae isolates that cause invasive disease among Chinese children. Clin Infect Dis. 2010;50:741-744.
26 Zhou X, Liu J, Zhang Z, et al. Molecular characteristics of penicillin-binding protein 2b, 2x and 1a sequences in Streptococcus pneumoniae isolates causing invasive diseases among children in Northeast China. Eur J Clin Microbiol Infect Dis. 2016;35:633-645.
27 Xu F, Chi FL, et al. Study on serotype distribution in 48 isolates of invasive Streptococcus pneumoniae with which children infected. Chin J Biochem Pharm . 2012;33:909-912.
28 Lu C. Investigation on serotype distribution of invasive pneumococcal disease isolates from children. Int J Lab Med. 2015;36:990-992.
29 Zhou K, Xie GJ, Wang XW, et al. Clinical characteristics of invasive pneumococcal disease and its serotype distribution. Chin J Nosocomiol. 2015;25. 3392-3394.
30 Wang J, Liu F, Ao P, et al. Detection of serotype distribution and drug resistance of Streptococcus pneumoniae isolated from pediatric patients. Lab Med. 2017;48:39-45.
31 Shi W, Li J, Dong F et al. Serotype distribution, antibiotic resistance pattern, and multilocus sequence types of invasive Streptococcus pneumoniae isolates in two tertiary pediatric hospitals in Beijing prior to PCV13 availability. Expert Rev Vaccines. 2019;18:89-94.
32 Ma X, Zhao R, Ma Z, et al. Serotype distribution and antimicrobial resistance of Streptococcus pneumoniae isolates causing invasive diseases from Shenzhen Children’s Hospital. PLoS One. 2013;8:e67507.
33 Liu Y, Wang H, Chen M, et al. Serotype distribution and antimicrobial resistance patterns of Streptococcus pneumoniae isolated from children in China Diagn Microbiol Infect Dis. 2008;61:256-263.
34 Wang Q, Wu J, Liu J, et al. Clinical features and outcomes of invasive pneumococcal disease in pediatric intensive care unit. chin J Appl Clin Pediatr. 2016 ;31:1400-1404.
35 Hu FP, Ding L, Guo Y, et al. CHINET 2023 national bacterial resistance surveillance results [Internet]. [cited 2024 Jul 17]. Available from: http://hncis.hnwsjk.cn/ganran/contents/41/11164.html
36 Liang Z, Fu J, Li L, et al.. Molecular epidemiology of Streptococcus pneumoniae isolated from pediatric community-acquired pneumonia in pre-conjugate vaccine era in Western China. Ann Clin Microbiol Antimicrob. 2021 Jan 6;20(1):4. DOI: 10.1186/s12941-020-00410-x
37 Wang CY, Chen YH, Fang C, et al. Antibiotic resistance profiles and multidrug resistance patterns of Streptococcus pneumoniae in pediatrics: A multicenter retrospective study in mainland China. Medicine (Baltimore). 2019;98(24):e15942.DOI: 10.1097/MD.0000000000015942