Search
Close this search box.

Epidemiology of HPV infection in China

Epidemiology of HPV infection in China

The epidemiology of HPV infection in China has both similarities and differences compared to the global data. Table 1 compiles the prevalence of HPV infection in China as summarized by different systematic reviews and meta-analysis studies. Published systematic reviews and multicenter studies have shown that the total corrected HPV infection rate in the general population ranges from about 13.1-18.8%, with a corrected infection rate of 12.95-17.1% for high-risk HPV and 3.28% for low-risk HPV [1, 2, 3].

The prevalence of HPV infection varies according to the region and the population group, with a range of about 14.9%-16.0% in urban areas and about 13.7%-16.3% in rural areas [4, 5]. The highest infection rates of total HPV, high-risk and low-risk types among women population (based on the regular physical check data) were in East China, with 17.54%, 14.17% and 3.75%, respectively. The total HPV infection rate, high-risk and low-risk HPV type infection rates were higher in South China than in the North [5]. HPV infection rates also vary by age groups. A multicenter cross-sectional survey study indicated that the rate of high-risk HPV infection in China showed a double-peak in puberty and perimenopause. The urban and rural HPV infection rates all change with age. Higher infection rates were observed in those younger than 25 and those between the ages of 41-45. The second peak of infection may be related to the increase in exposure to HPV, and the changes in the internal environment of the female organism and the immune system [2, 6].

Table 1. Systematic reviews and meta-analysis studies related to HPV infection rate in China

First author (year of publication)Research methodologyKey findings
General Population or Population with Routine Physical Check
Zhu et al. (2019)[3]Systematic review and data review, incorporating data from 71 different sources of databases and literature published by October 2018The national prevalence of HPV infection was about 15.54% (95% CI: 13.83%-17.24%), 14.86% (95% CI: 12.84%-16.88%) in the urban areas and 13.70% (95% CI: 11.18%-16.22%) in the rural areas. Among them, 19.85% (3.46%-36.23%) were in the Northeast, 18.43% (95% CI: 13.39%-23.46%) in the North, 12.96% (95% CI: 8.44%-17.48%) in the Central, 13.51% (11.34%-15.68%) in the South, 12.92% (95% CI: 5.31%-20.48%) in the Southwest, 12.57% (95% CI: 8.49%-16.65%) in the Northwest, and 15.99% (95% CI: 12.84%-19.13%) in the East.
Yu et al. (2020) [5]Studies on HPV infection and type distribution among the Chinese female population with routine physical checks between 1995 and 2016 were reviewed, and 19 papers were included.The prevalence of HPV infection among the population with routine physical checks in Mainland China was 16.18% (95% CI: 14.16-18.20%). The prevalence of high-risk types was 12.95%, and that of low-risk types was 3.28%. The most common types of HPV were HPV 16, 52, 58, 33, 18, and 68. The highest total HPV prevalence among the population with routine physical checks was in Central China (17.54%), and the highest prevalence of high-risk and low-risk types was in East China (14.17% and 3.75%, respectively). The total infection and high-risk and low-risk infection rates were higher in the south than in the north.
People with cervical cancer lesions
Wei et al. (2020) [7]Studies on HPV infection and type distribution in the Chinese female population between January 1990 and October 2018 were reviewed, and a total of 63 papers were included.The total HPV infection rate gradually increased with the severity of lesion grade, and was 67.2%, 79.1%, 85.9% and 85.3% in the cervical intraepithelial neoplasia grade 1 (CIN1), cervical intraepithelial neoplasia grade 2 (CIN2), cervical intraepithelial neoplasia grade 3 (CIN3) and cervical cancer populations, respectively. The distribution of HPV types varied among different grades of cervical lesions, with HPV16/18/58 being the top three most common types in cervical cancer, HPV16/58/52 in both CIN3 and CIN2, and HPV16/52/58 in CIN1. HPV52 was the second most common type in CIN1, but its proportion began to decline in CIN2, CIN3 and cervical cancer. The prevalence and type distribution of HPV infection varied in different regions, with high-risk HPV infection being the most common type of infection in each region.
Zhang et al. (2020) [8]Meta-analysis including 8 studies published from 2000-2019In 2950 CIN1 and 5393 CIN2/3 patients, the prevalence of HPV infection was 84.37%. The prevalence of CIN1 patients was 79.56% and the most common genotypes were HPV52, 16, 58, 18, 53. The prevalence of HPV infection in CIN2/3 patients was higher at 87% and the most common genotypes were HPV16, 58, 52, 33, 31.

HPV: human papillomavirus CIN: cervical intraepithelial neoplasia, CI: confidence interval

HPV16, 52, 58, 33, 18, and 68 are the common HPV genotypes in China, of which the prevalence of HPV types are HPV16 (2.66%-3.52%), HPV52 (2.20-2.66%), HPV58 (1.94%-2.10%), HPV18 (0.87%-1.20%), and HPV33 ( 0.87%-1.02%) [1, 2]. In China, low-risk types are mainly HPV6, 11 and 42. Among them, HPV types vary in different regions. Table 2 lists the common HPV types in healthy populations in seven regions of China.

Table 2. Common HPV types in different regions of China

RegionCommon HPV types
NorthHPV-16 /6 /56 /66 /33 /11
NorthwestHPV-16 /52 /58 /33 /18 /31
EastHPV-16 /52 /58 /18 /33 /68
SouthHPV-52 /16 /58 /51 /56 /18
CentralHPV-52 /58 /16 /66 /33 /68
SouthwestHPV-52 /58 /16 /68 /56 /66
NorthwestHPV-16 /58 /35 /18 /6 /39

(Source: Yu Yanqin et al. (2019). A systematic review of human papillomavirus prevalence and distribution of HPV genotypes covered by the nine-valent vaccine among women undergoing routine physical checks in mainland China. Tumor Prevention and Treatment, 32(2), 103-113. )

Studies in China have also found that in patients with different grades of cervical lesions and different degrees of cervical cancer, the prevalence of HPV infection gradually increases with the severity of lesion grade [7, 8]. A multicenter population-based cross-sectional study found that the prevalence of infection was 37.1% in women with atypical squamous epithelial cell alterations (ASCUS), 90.9% in women with low-grade squamous intraepithelial lesions (LSIL), and 93.06% in women with high-grade squamous intraepithelial lesions (HSIL) [9]. In those with varying degrees of cervical lesions, the prevalence of HPV infection increased with the degree of the lesion, common types being HPV16 (59.5%), HPV18 (9.6%), HPV58 (8.2%), HPV52 (6.5%), and HVP33 (3.5%) [1, 7].

Another systematic review found that the common HPV types among women with CIN1 were HPV52 (20.31%), HPV16 (16.81%), HPV58 (14.44%), HPV18 (6.44%), and HPV53 (5.76%), whereas the common HPV types among women with CIN2/3 were HPV16 (45.69%), HPV58 (15.50%), HPV52 (11.74%), HPV33 (9.35%) and HPV31 (4.34% ) [8,10]. Table 3 summarizes the major HPV types in patients with different grades of cervical lesions and cervical cancer in different regions of China.

Table 3. The most common HPV types in patients with cervical cancer of different regions and levels in China

RegionPatients with invasive cervical cancerCervical intraepithelial
Neoplasia grade 3
Cervical intraepithelial
Neoplasia grade 2
Cervical intraepithelial
Neoplasia grade 1
EastHPV16/18/58HPV16/58/52HPV16/58/52HPV16/52/58
SouthHPV16/18/58HPV16/52/58HPV52/16/58HPV52/16/58
WestHPV16/18/58HPV16/58/33HPV16/58/52HPV52/16/58
NorthHPV16/18/58HPV16/58/33HPV16/58/52HPV16/52/58

(Source: WEI Meng-na,YU Yan-qin,XU Hui-fang,etc. Prevalence and genotypes distribution of human papillomavirus in patients with different grades of cervical lesions in mainland China. Chinese Journal of Clinical Oncology and Rehabilitation,2020,02:133-137)


Content Reviewer: Kelly Hunter, Zhangyang Pan

Page Editor: Jiaqi Zu


References:

  1. Wang HQ, Zhao FH, Zhao Y. Expert consensus on immunological prevention of human papillomavirus-related diseases. Chinese Journal of Preventive Medicine. 2019, 53(8):761-803.
  2. Zhao FH, Lewkowitz AK, Hu SY, Chen F, Li LY, Zhang QM, Wu RF, Li CQ, Wei LH, Xu AD: Prevalence of human papillomavirus and cervical intraepithelial neoplasia in China: A pooled analysis of 17 populationbased studies. International journal of cancer 2012, 131(12):2929-2938.
  3. Zhu B, Liu Y, Zuo T, Cui X, Li M, Zhang J, Yu H, Piao H: The prevalence, trends, and geographical distribution of human papillomavirus infection in China: The pooled analysis of 1.7 million women. Cancer medicine 2019, 8(11):5373-5385.
  4. Shan W, Zhang T, Zhang TJ, Zhao GM. The epidemiological situation of human papillomavirus infection among women in China. Chinese Journal of Disease Control & Prevention 2017, 21(1):89-93.
  5. Yu Yanqin et al. (2019). A systematic review of human papillomavirus prevalence and distribution of HPV genotypes covered by the nine-valent vaccine among women undergoing routine physical checks in mainland China. Tumor Prevention and Treatment, 32(2), 103-113.
  6. Zhang SK, Zhao FH, Qiao YL. Development and achievements regarding the prevention and control of cervical cancer in the last 20 years in China. Chinese Journal of Epidemiology 2020, 41(6):809-812.
  7. Wei MN, Yu YQ, Xu HF, Fu SL, Hu SY, Zhao FH, Qiao YL. Prevalence and genotypes distribution of human papillomavirus in patients with different grades of cervical lesions in China’s Mainland. Chinese Journal of Clinical Oncology and Rehabilitation 2020, 2.
  8. Zhang J, Cheng K, Wang Z: Prevalence and distribution of human papillomavirus genotypes in cervical intraepithelial neoplasia in China: a meta-analysisArchives of Gynecology and Obstetrics 2020:1-9.
  9. Wu E-Q, Liu B, Cui J-F, Chen W, Wang J-B, Lu L, Niyazi M, Zhao C, Ren S-D, Li C-Q: Prevalence of type-specific human papillomavirus and pap results in Chinese women: a multi-center, population-based cross-sectional study. Cancer causes & control 2013, 24(4):795-803.
  10. Chen W, Molijn A, Enqi W, Zhang X, Jenkins D, Yu X, Quint W, Schmidt JE, Li J, Pirog E: The variable clinicopathological categories and role of human papillomavirus in cervical adenocarcinoma: A hospital-based nationwide multicenter retrospective study across China. International journal of cancer 2016, 139(12):2687-2697.

代表性地区的基本情况、接种政策及效果、宣传推动情况

(1) 成都市


基本情况

成都市2022年度GDP为20817.5亿元,排名全国城市第七。成都市出台了《健康城市建设推动健康中国行动创新模式成都市宫颈癌综合防控试点工作方案》等一系列相关政策推动适龄女孩HPV疫苗接种工作。

接种政策及效果

目标人群为13-14岁在校且无HPV疫苗接种史女生。免疫程序为国产二价0-6二剂次、进口二价0-1-6三剂次、进口四价0-2-6三剂次。资助政策为国产二价疫苗(沃泽惠)免费,其它疫苗补贴600元/人,并自付20元/剂接种费。疫苗接种按照属地化管理原则,由学校所在地预防接种单位负责。截至2022年1月,目标人群首针接种率达90.04%[14]。

宣传推动

成都市开展多形式、多载体的健康教育宣传。形式包括讲座、知晓日、义诊咨询、专题课程、专题活动等,载体包括宣传册、宣传栏、展板、电视、微信、视频号、抖音平台等,覆盖相关医疗机构300余、社区300余个、和公众场所90余个。面向适龄女孩及监护人、适龄女性及全体市民开展广泛宣教,宣传材料发放至近9万名群众,讲座活动覆盖近2万名群众。宣教内容包括HPV疫苗接种、两癌防控、其它女性常见疾病防控等。

(2) 济南市


基本情况

济南市2022年度GDP为12027.5亿元,位列全国城市排名20。2021年,济南市出台《健康城市建设推动健康中国行动创新模式试点一济南市宫颈癌综合防治工作方案(2021—2025年)》等一系列相关政策推动适龄女孩HPV疫苗接种工作。

接种政策及效果

目标人群为≤14周岁且无HPV疫苗接种史的在校七年级女生。免疫程序为国产二价0-6二剂次。资助政策免费接种。疫苗接种按照属地化管理原则,安排分班级分时段前往学校所在地的预防接种单位进行接种。截至2022年11月,目标人群首针接种率达
94.4%[15].

宣传推动

济南市开展多形式、多载体的健康教育宣传。形式包括采访、线上线下专题活动,载体包括网络媒体、纸媒、科普展板、宣传手册、子宫颈癌与HPV疫苗知识读本、济南HPV疫苗接种手册,宣教人群广泛涵盖全体市民,宣教内容包括HPV疫苗接种、两癌防控等知识。

(3) 鄂尔多斯市


基本情况

鄂尔多斯市2022年度GDP为5613.44亿元,全国地级市第45位。2021年,鄂尔多斯市出台了《健康城市建设推动健康鄂尔多斯行动创新模式工作方案》等一系列相关政策推动适龄女孩HPV疫苗接种工作。

接种政策及效果

2020年8月,鄂尔多斯市在准格尔旗率先开展HPV疫苗免费接种项目。目标人群为全市当年13-18岁在校且无HPV疫苗接种史女生。免疫程序为进口二价0-1-6三剂次,

2023年起调整为13-14岁女孩0-6二剂次。资助政策为疫苗免费,自付20元/剂接种费。组织方式为疫苗接种服务中心根据任务安排联系学校,有规划的通知适龄女孩前来完成HPV疫苗接种。截至2022年11月,目标人群首针接种率接近70%[16]。

2022年8月,启动准格尔旗和达拉特旗高三女生接种四价和九价HPV疫苗的试点工作,利用暑假时间展开接种,力争在2023年年底达成90%的接种目标[17]。自鄂尔多斯之后,由政府主导的HPV疫苗惠民行动在多地等涌现。值得注意的是,近年来多主体参与到HPV疫苗支持项目,如慈善总会、医院、妇联等为主体单位牵头组织开展了一些公益活动。

宣传推动

鄂尔多斯市开展多形式、多载体的健康教育宣传。形式包括讲座、知晓日、义诊咨询、专题课程、专题活动等,载体包括宣传册、宣传栏、展板、电视、微信、视频号、抖音平台等,宣教人群广泛涵盖在校女孩及监护人,适龄女性及全体市民。宣教内容包括HPV疫苗接种、两癌防控、其它女性常见疾病防控等。

(4) 西安市


基本情况

西安市2022年度GDP为11486.51亿元,排名全国第22位。2021年,西安市出台了《西安市健康城市建设推动健康中国行动创新模式试点宫颈癌综合防治工作方案》等一系列相关政策推动适龄女孩HPV疫苗接种工作。

接种政策及效果

目标人群为全市年龄满13周岁(初中)在校女生。免疫程序为国产二价0-6二剂次,进口二价0-1-6三剂次,进口四价和进口九价0-2-6三剂次。接种政策为自愿自费。各区(县)合理设立HPV疫苗专项疫苗接种门诊承担接种任务,并及时将接种信息统一录入儿童免疫规划信息平台。

宣传推动

西安市出台了《西安市宫颈癌综合防治宣传方案》(市健办发〔2022〕12号)。通过媒体宣传、社区活动、义诊等形式,宣传册、宣传栏、展板、电视、微信公众号、报纸等载体普及宫颈癌防治相关知识。

(5) 西藏自治区


基本情况

西藏自治区2022年度GDP为2132.64亿元,经济总量整体规模相对其他省份较小,人均GDP处于全国中等偏下水平。2022年出台《西藏自治区妇女“两癌”综合防治工作实施方案》等系列政策推动适龄女孩HPV疫苗接种。

接种政策及效果

目标人群为13-14岁在校女生。免疫程序为国产二价0-6二剂次。资助政策为免费。由学校组织,接种者在商定接种时间携带个人身份证明材料与法定监护人一同前往定点接种单位接种。

宣传推动

充分利用网络、电视、广播、报刊等媒介,以群众喜闻乐见的宣传方式,对适龄在校女生HPV疫苗接种工作的意义及内容进行广泛宣传。

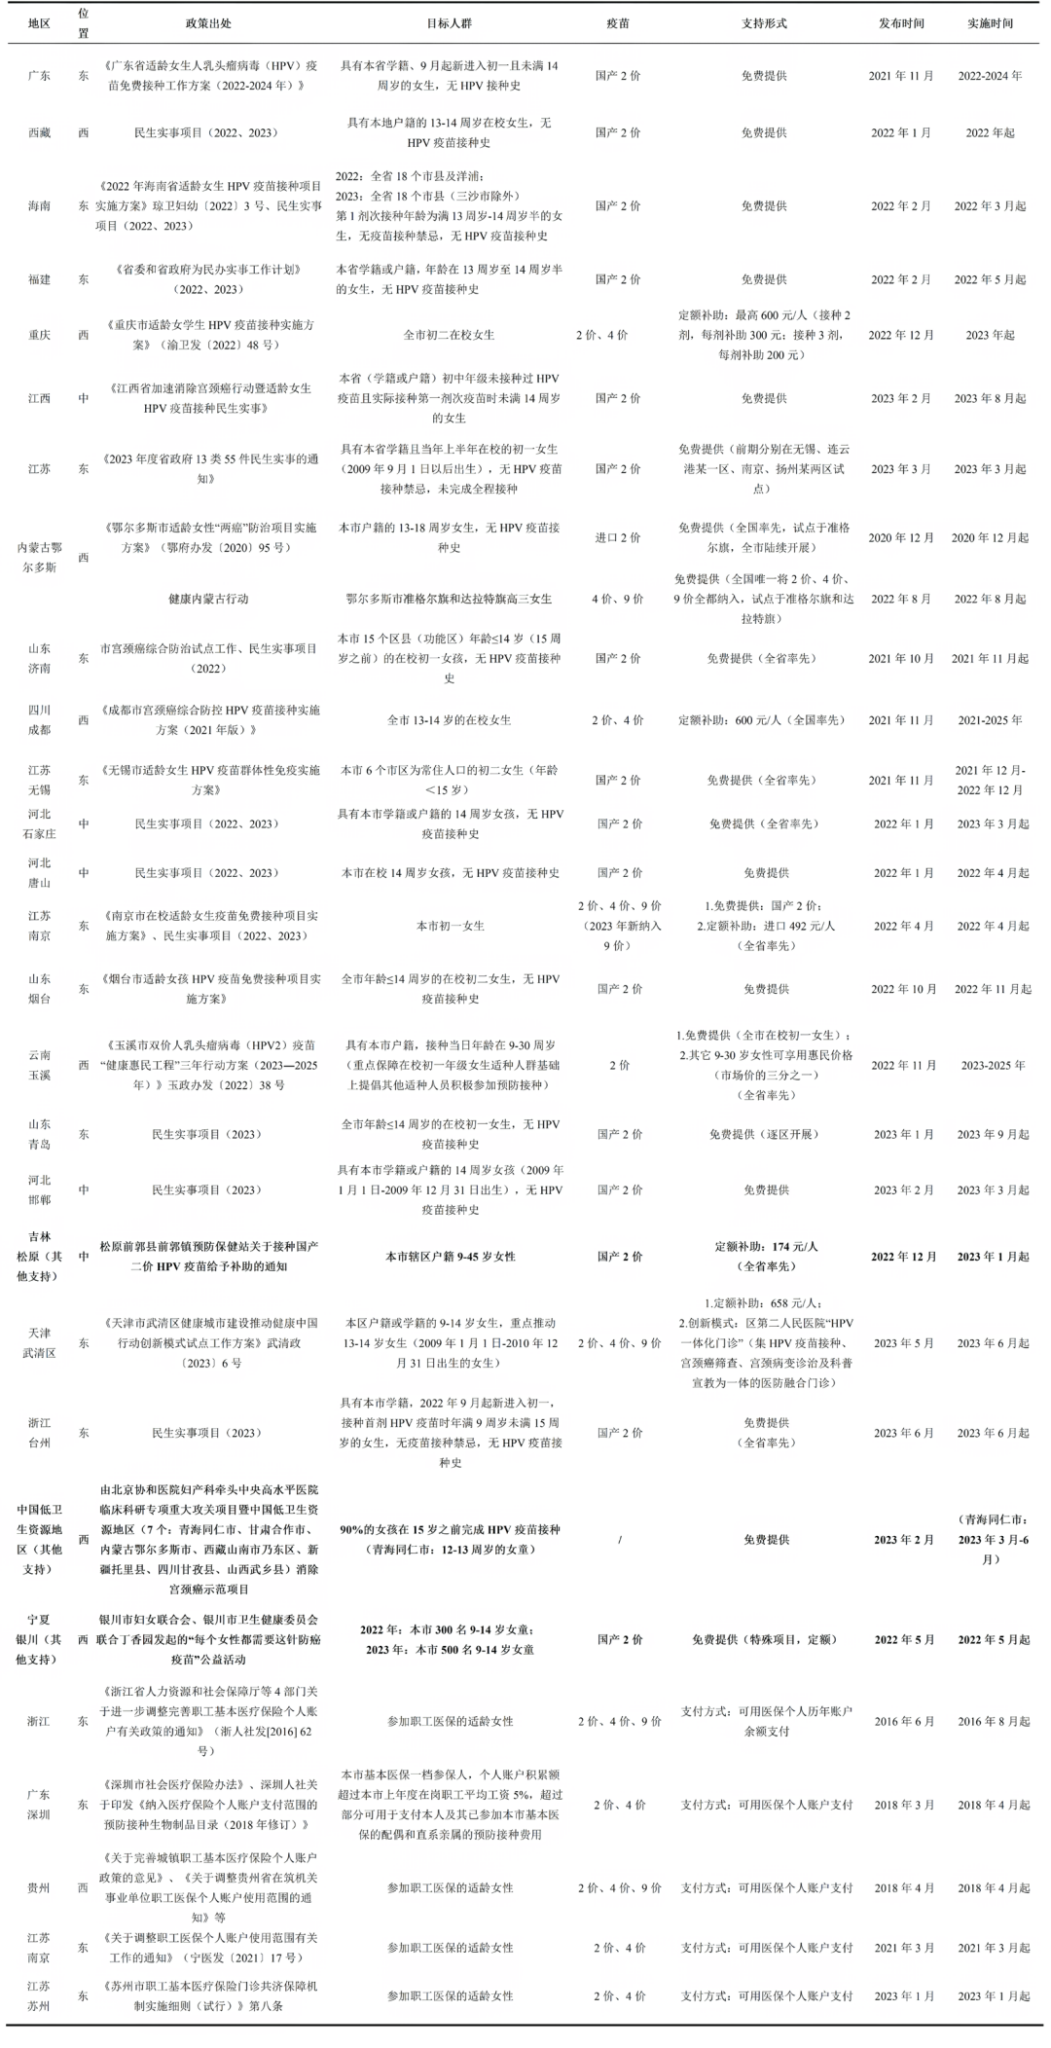
近年来各地HPV疫苗惠民项目信息

“疾病负担”指标解读

疾病负担(burden of disease, BOD)是指疾病造成的失能(伤残)、生活质量下降和过早死亡对健康和社会造成的总损失,包括疾病的流行病学负担和经济负担两个方面。


在疾病的流行病学方面,衡量疾病负担的常用指标包括传统指标和综合指标。


传统指标

传统疾病负担的衡量指标包括:用于描述和反映健康状况与水平的常规指标,如死亡人数、伤残人数和患病人数等绝对数指标;以及用来比较不同特征人群疾病分布差异的指标,如发病率、伤残率、患病率、死亡率、门诊和住院率等相对数指标。


上述传统疾病负担的衡量指标基本上只考虑了人口的生存数量,而忽略了生存质量,不够全面;但优势在于资料相对计算方便,结果直观,可用于各种疾病的一般性描述。


综合指标

疾病负担不等同于死亡人数,综合指标弥补了传统指标的单一性,且可以让各种不同疾病造成的负担之间相互比较。


潜在寿命损失年(YPLL):通过疾病造成的寿命损失来估计疾病负担的大小。但忽略了疾病造成的失能对生存质量的影响。


伤残调整寿命年(DALYs):将死亡和失能相结合,用一个指标来描述疾病的这两方面的负担。它包括因早死造成健康生命年的损失(YLL)和因伤残造成健康生命年的损失(YLD),即DALY=YLL+YLD。目前,DALY是国内外一致公认的最具代表性、运用最多的疾病负担评价指标。


健康期望寿命(HALE):指具有良好健康状态的生命年以及个体在比较舒适的状态下生活的平均预期时间,综合考虑生命的质量和数量两方面。


随着疾病负担研究的深入,其测量范围从流行病学负担扩大到经济负担。


疾病经济负担是由于发病、伤残(失能)和过早死亡给患者本人、家庭以及社会带来的经济损失,和由于预防治疗疾病所消耗的经济资源。

详细见:疾病的“经济负担”怎么计算?


参考资料:

陈文. 卫生经济学 [M]. 人民卫生出版社. 2017.

李茜瑶,周莹,黄辉等.疾病负担研究进展[J].中国公共卫生,2018,34(05):777-780.

什么是“年龄标化”?

在流行病学研究中,年龄是多种疾病的危险因素。以发病率为例,该指标反映了一定时期内,特定人群中癌症新发病例的情况。由于年龄是癌症发生的一个重要影响因素,年龄越大,发病率就越高。


如果两个国家的人群年龄结构相差很大,例如A市老年人口比例更大,B市年轻人口占比更高,直接比较两地癌症发病率的高低,我们不能确定发病率较高的市,是因为年龄构成不同还是因为其他影响因素(如饮食习惯、环境等)所导致。因此,需要用“年龄标化”的统计学方法,进一步处理数据,排除年龄影响因素的干扰,再来比较两地的发病率数据。


以发病率为例,即把原始数据套到一个“标准年龄结构人群里”,计算出”年龄标化发病率“,这样人群结构不同的A市和B市,就能在同一个指标尺度下进行“发病率”比较。年龄标化通常有“中标率”,即我国各地基于某一年份的中国人口年龄结构构成作为标准计算,国内不同地区的疾病数据比较采用的是“中标率”;另一种是“世标率”,即用世界标准人口构成机型标化计算,适用于国与国之间的指标比较。


同样地,以死亡率为例,应特别注意各之间地人口构成的差异。用标准化死亡率进行比较才能得出正确结论。如甲、乙两地在未标化前的肺癌死亡率相同,但实际上乙地人群的肺癌死亡率要明显地高于甲地,其原因在于甲地男性老年人口居多,而肺癌的死亡率又与年龄和性别有关,所以用未标化率进行比较时,就会得出甲乙两地肺癌死亡率相同的错误结论。


参考资料:


张科宏教授:年龄标化的患病率 – 丁香公开课 (dxy.cn)

科学网—癌症(粗)发病率与标化发病率的区别 – 杨雷的博文 (sciencenet.cn)

WHO年龄标化死亡率定义及计算方法

沈洪兵,齐秀英. 流行病学 [M]. 人民卫生出版社. 2015.

疾病的“经济负担”怎么计算?

疾病经济负担是由于发病、伤残(失能)和过早死亡给患者本人、家庭以及社会带来的经济损失,和由于预防治疗疾病的费用。通过计算疾病的经济负担,可以从经济层面上研究或比较不同疾病对人群健康的影响。

总疾病经济负担包括直接疾病经济负担、间接疾病经济负担和无形疾病经济负担。

直接经济负担:指直接用于预防和治疗疾病的总费用,包括直接医疗经济负担和直接非医疗经济负担两部分。直接医疗经济负担是指在医药保健部门购买卫生服务的花费,主要包括门诊费(如挂号费、检查费、处置费、诊断费、急救费等)、住院费(如手术费、治疗费等)和药费等。直接非医疗经济负担包括和疾病有关的营养费、交通费、住宿费、膳食费、陪护费和财产损失等。

间接经济负担:指由于发病、伤残(失能)和过早死亡给患者本人和社会带来的有效劳动力损失而导致的经济损失。具体包括:劳动工作时间损失、个人工作能力和效率降低造成的损失、陪护病人时损失的劳动工作时间、精神损失等。

无形经济负担:指患者及亲友因疾病在心理、精神和生活上遭受的痛苦、悲哀、不便等生活质量下降而产生的无形损失。


参考资料:

陈文. 卫生经济学 [M]. 人民卫生出版社. 2017.

李茜瑶,周莹,黄辉等.疾病负担研究进展[J].中国公共卫生,2018,34(05):777-780.